Penta & Co. - Retail Sales Analysis
| Title of the Project |
Penta & Co. Retail Sales Analysis |
| Students Details |
201711409 Hauwa Maijidah Galadima 201711489 Amal Gholoom Murad Hussein 201811033 Ramsha Ansari 201811252 Reem Amer Omar 201811731 Sirin saeed zanzoul
|
| Abstract |
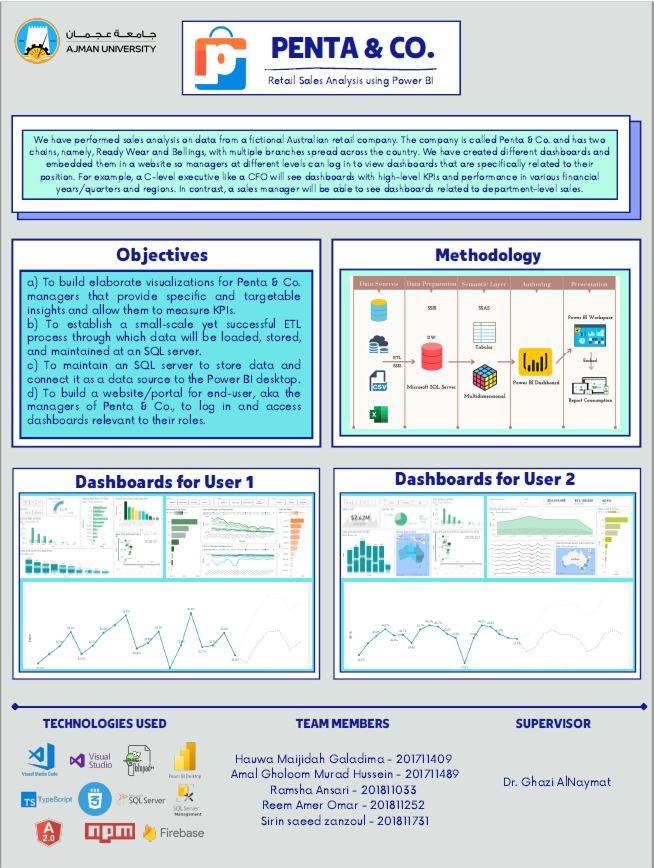
In today's business world, organizations produce and generate data enormously. To make effective results from these data and use them to achieve the desired outcomes and goals, many companies use business intelligence tools to turn data into coherent, visually immersive, and interactive insights. BI lets you connect to the data sources quickly and visualize and discover what's significant, which helps managers, executives, and employees make the right business decisions. We are implementing BI for a fictional Australian retail company called Penta & Co, using Microsoft Power BI that contains a combination of analytics, data management and reporting tools, and various methodologies for managing and analyzing data. We have followed a data warehousing approach in which we aim to demonstrate an ETL process through which the data will be loaded into our SQL server, which will then act as the data source for our Power BI. Our data model is a Star Schema using which we have created various reports. These dashboards are embedded in a website, so managers of Penta & Co. at different levels can log in to view dashboards specifically related to their position. For example, a C-level executive like a CFO will see dashboards with high-level KPIs and performance in various financial years/quarters and regions. In contrast, a sales manager will be able to see dashboards related to department-level sales. |