Student Progress and Completion
First-Year Retention Rate
Insight:
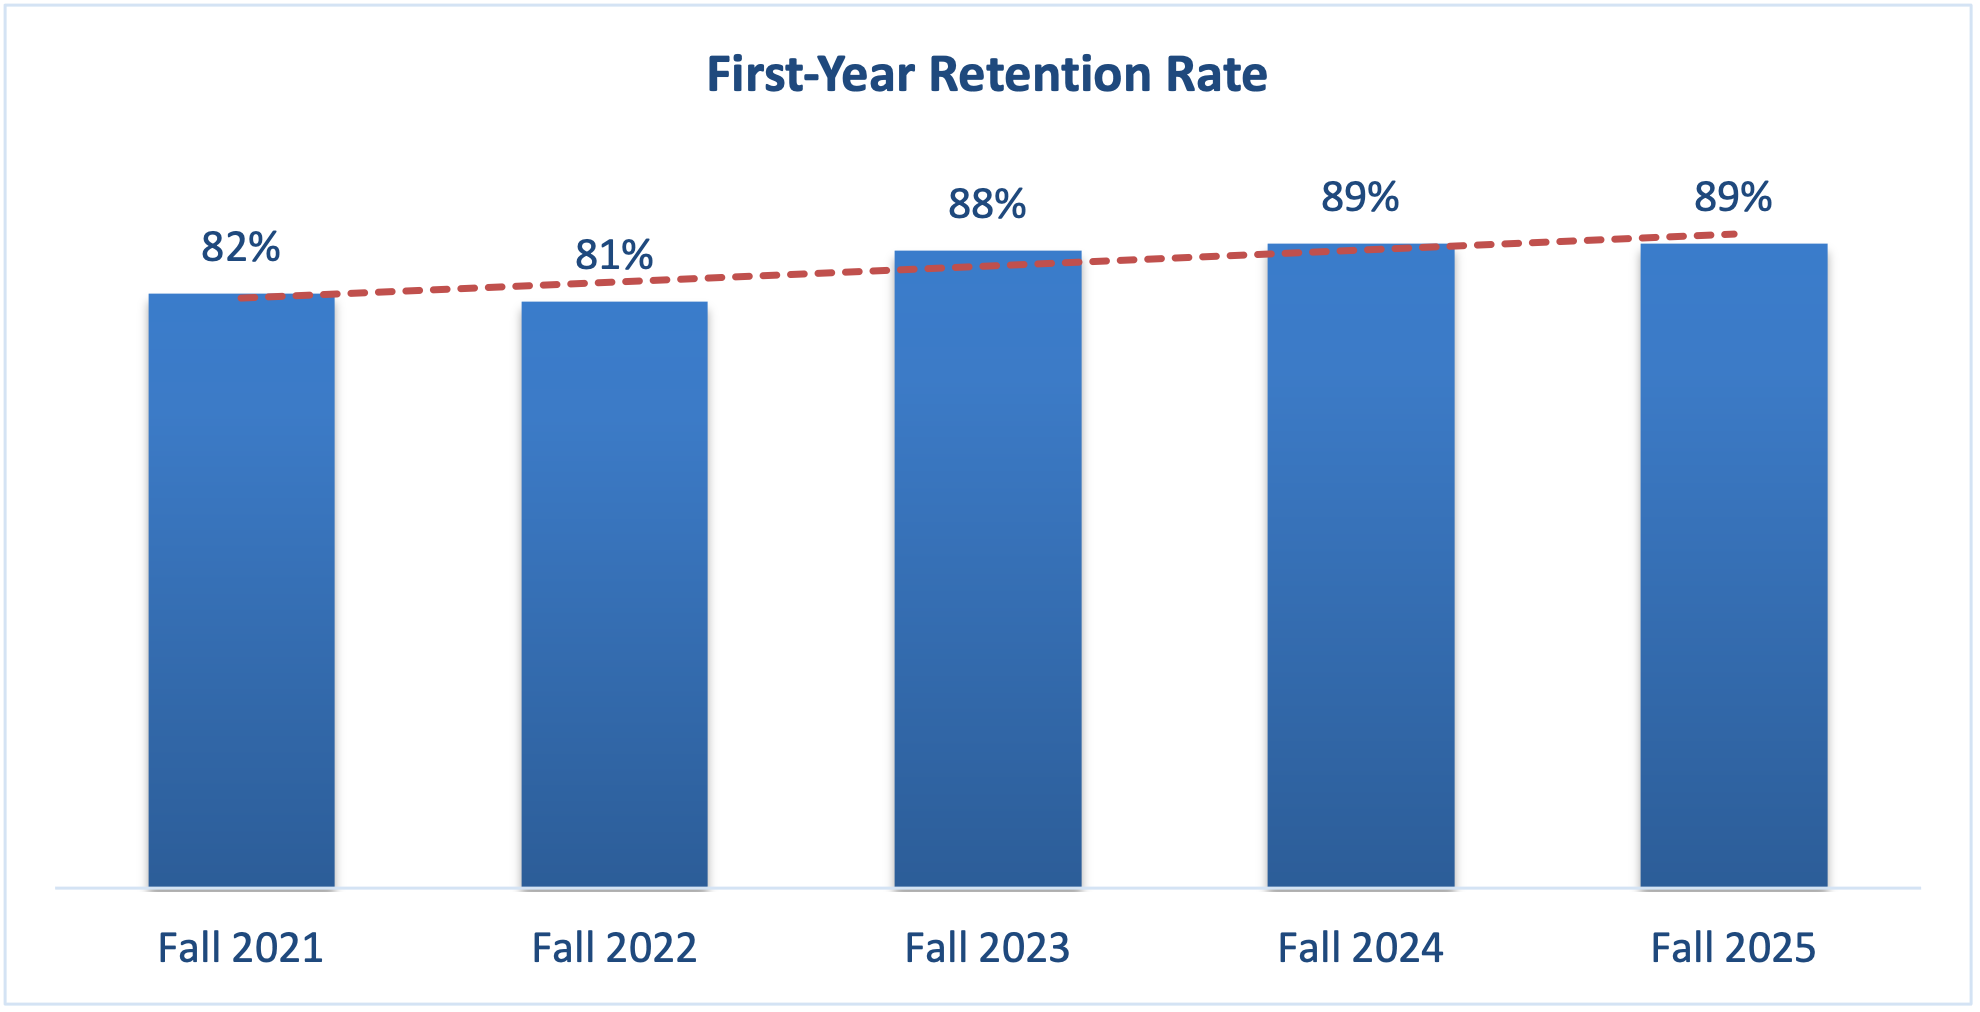
The University’s first-year retention rate demonstrates an overall positive Fall-to-Fall trend across the reported academic years, reflecting sustained student persistence and continued institutional support for student success and progression.
Definition:
The percentage of first-time undergraduate students who enrolled in the Fall semester and subsequently re-enrolled in the following Fall semester. Registration postponements or approved semester deferments are not considered attrition.
Formula:
(Number of first-time undergraduate students who re-enrolled in the subsequent Fall semester ÷ Total number of first-time undergraduate students in the original Fall cohort) × 100
Undergraduate Progression Rate
Insight:
The University-wide Undergraduate Progression Rate remained consistently high over the five-year period, increasing from 89% in Fall 2020–2021 to 94% in Fall 2024–2025. Most colleges demonstrated stable or improving progression trends, reflecting effective academic support mechanisms, student advising, and continued student success initiatives across the institution.
Five-Year Trend of Overall Undergraduate Progression Rate
Fall 2020–2021 to Fall 2024–2025
| College | 2020-2021 | 2021-2022 | 2022-2023 | 2023-2024 | 2024-2025 |
|---|---|---|---|---|---|
|
Architecture, Art & Design |
92% |
95% |
90% |
94% |
95% |
|
Business Administration |
86% |
85% |
90% |
90% |
89% |
|
Dentistry |
95% |
94% |
97% |
96% |
96% |
|
Engineering & IT |
86% |
86% |
90% |
90% |
89% |
|
Humanities & Sciences |
87% |
99% |
98% |
99% |
98% |
|
Law |
89% |
93% |
97% |
97% |
98% |
|
Mass Communication |
88% |
95% |
96% |
95% |
96% |
|
Medicine |
82% |
98% |
98% |
99% |
99% |
|
Pharmacy & Health Sciences |
91% |
94% |
94% |
94% |
97% |
|
University Wide |
89% |
92% |
94% |
94% |
94% |
Definition:
The Undergraduate Progression Rate refers to the percentage of undergraduate students who continued from the previous Fall semester and maintained a cumulative grade point average (CGPA) of 2.00 or higher. The indicator reflects students’ successful academic progression and satisfactory academic standing.
Formula:
(Number of undergraduate students retained from the previous Fall semester with a CGPA of 2.00 or higher ÷ Total number of undergraduate students eligible for progression) × 100
Success Rate by Program
Insight:
Most academic programs achieved or exceeded the institutional success rate benchmark of 90%, reflecting strong student academic performance and successful course completion across undergraduate and graduate programs. Several graduate programs achieved a 100% success rate, while a limited number of programs fell slightly below the institutional KPI target, indicating opportunities for targeted academic support and student success interventions.
Success Rate
Academic Year 2024-2025
| Program | Achieved (%) | KPI Target (%) |
|---|---|---|
|
BA in Psychology |
95.69% |
90% |
|
BA Sociology and Social Work |
98.87% |
90% |
|
Bachelor of Architectural Engineering |
94.75% |
90% |
|
Bachelor of Architecture |
97.28% |
90% |
|
Bachelor of Law |
98.01% |
90% |
|
Bachelor of Pharmacy |
98.97% |
90% |
|
Bachelor of Interior Design |
97.83% |
90% |
|
BSc in Accounting |
95.70% |
90% |
|
BSc in Biomedical Engineering |
86.85% |
90% |
|
BSc in Computer Engineering |
91.01% |
90% |
|
BSc in Civil Engineering |
83.65% |
90% |
|
BSc in Electrical Engineering |
87.02% |
90% |
|
BSc in Mechanical Engineering |
78.65% |
90% |
|
BSc in Nursing |
98.43% |
90% |
|
BSc in Management |
89.72% |
90% |
|
BSc in Marketing |
91.03% |
90% |
|
BSc in Data Analytics |
86.53% |
90% |
|
Bachelor of Dental Surgery |
97.66% |
90% |
|
Doctor of Medicine (GR) |
100.00% |
90% |
|
Doctorate of Business Administration |
100.00% |
90% |
|
BSc in Finance |
94.76% |
90% |
|
BSc in Information Systems |
86.08% |
90% |
|
BSc in Information Technology |
84.96% |
90% |
|
MSc in Artificial Intelligence |
100.00% |
90% |
|
Bachelor of Mass Communication |
96.37% |
90% |
|
Master of Digital Sociology |
100.00% |
90% |
|
Master of Business Administration |
100.00% |
90% |
|
Doctor of Medicine |
99.09% |
90% |
|
Master of Public Relations and Corporate Communication |
100.00% |
90% |
|
Master of Law in Private Law |
100.00% |
90% |
|
Master of Law in Public Law |
100.00% |
90% |
|
MSc in Endodontics Dentistry |
100.00% |
90% |
|
MSc in Clinical Pharmacy |
100.00% |
90% |
|
MSc in Pediatric Dentistry |
100.00% |
90% |
|
MSc in Restorative Dentistry |
100.00% |
90% |
|
MSc in Urban Design |
100.00% |
90% |
|
PhD in Law |
100.00% |
90% |
|
Professional Graduate Diploma in Teaching |
100.00% |
90% |
Definition:
The Success Rate represents the percentage of registered credit hours successfully completed by continuing students during the Fall semester.
Formula:
(Total successfully completed credit hours ÷ Total registered credit hours) × 100
Graduation Rates
Insight:
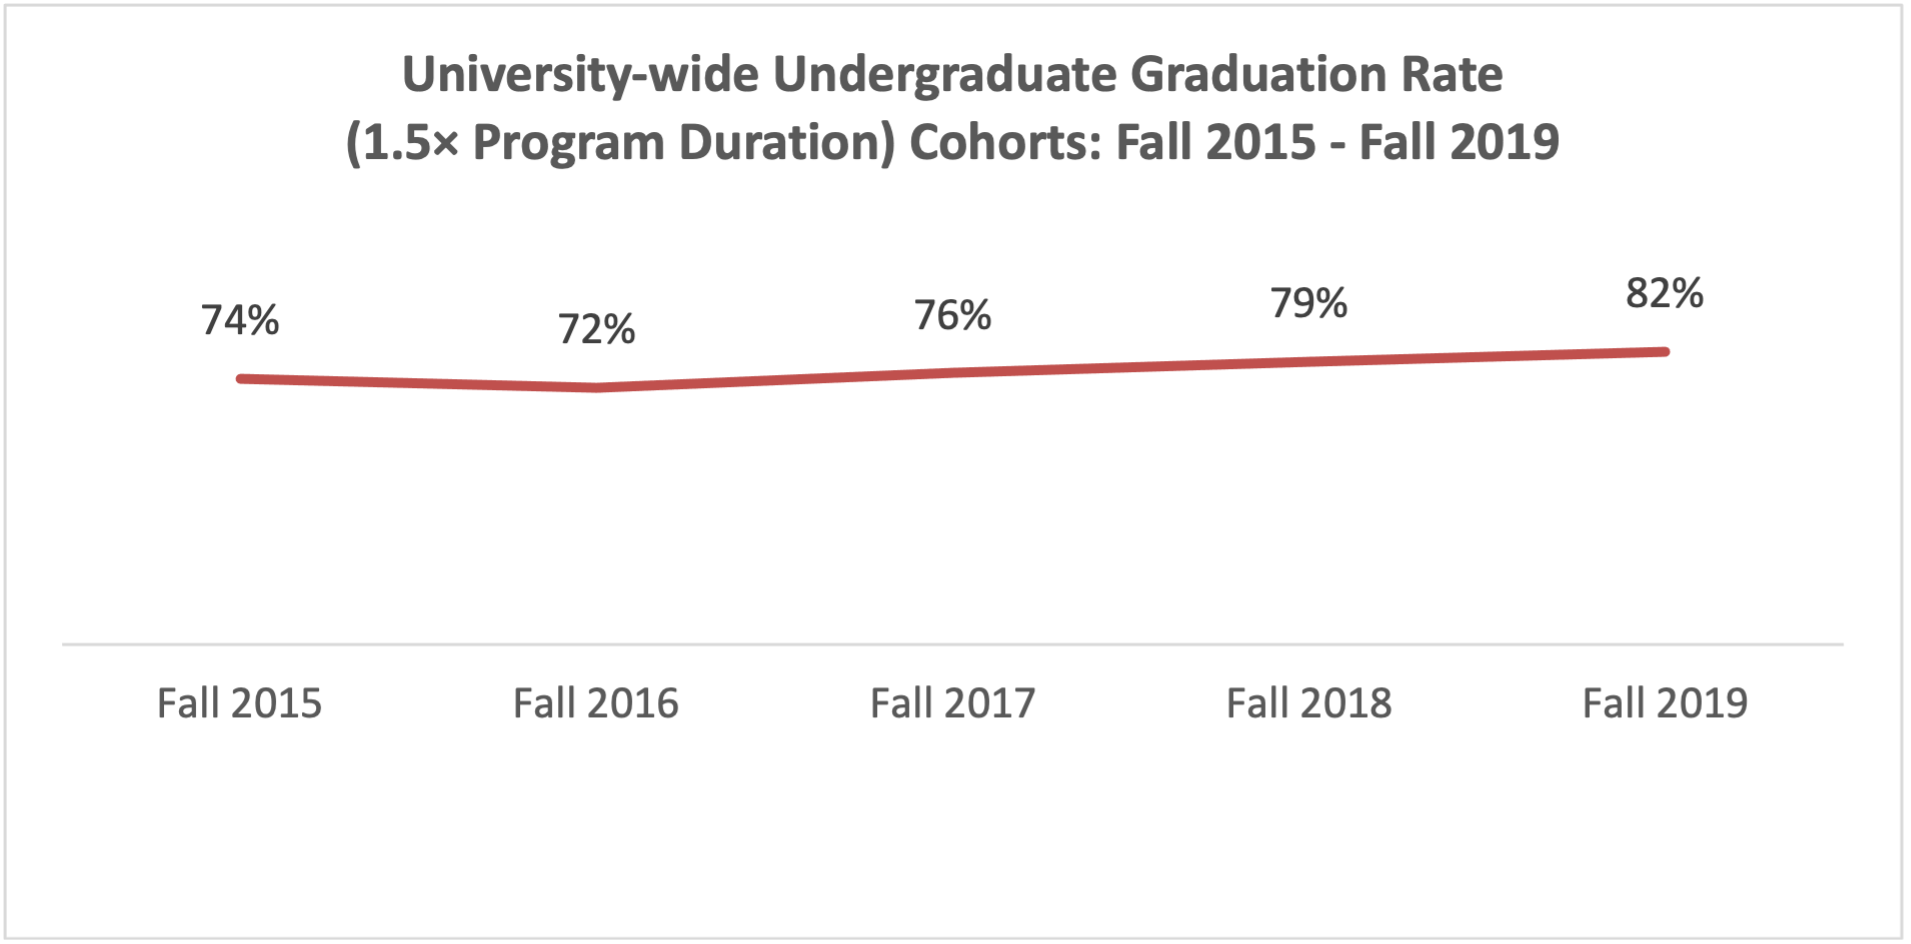
The University-wide undergraduate graduation rate shows a steady improvement over the five cohorts, increasing from 74.00% for the Fall 2015 cohort to 81.63% for the Fall 2019 cohort. This upward trend indicates stronger student progression and completion within 1.5 times the standard program duration. At the college level, several colleges recorded notable improvements, particularly Humanities & Sciences, Law, and Dentistry, while some variation across colleges reflects differences in program structure, cohort characteristics, and field-specific academic requirements.
Five-Year Trend of Undergraduate Graduation Rate (Fall Cohorts)
Graduation within 1.5 Times the Standard Program Duration
Cohorts from Fall 2015 to Fall 2019
Five-Year Trend of Undergraduate Graduation Rate by College (Fall Cohorts) Graduation within 1.5 Times the Standard Program Duration Cohorts from Fall 2015 to Fall 2019
| College | Fall 2015 | Fall 2016 | Fall 2017 | Fall 2018 | Fall 2019 |
|
Architecture, Art and Design |
68.90% |
73.40% |
70.50% |
76.90% |
73.75% |
|
Business Administration |
71.10% |
75.50% |
78.10% |
73.30% |
76.19% |
|
Dentistry |
84.50% |
76.50% |
88.40% |
89.50% |
91.71% |
|
Engineering & IT |
72.90% |
66.20% |
65.70% |
79.20% |
75.76% |
|
Humanities & Sciences |
66.90% |
62.70% |
58.30% |
66.70% |
89.23% |
|
Law |
60.60% |
56.60% |
68.50% |
67.20% |
74.49% |
|
Mass Communication |
75.30% |
74.40% |
77.70% |
84.00% |
70.34% |
|
Pharmacy & Health Sciences |
86.50% |
93.50% |
88.00% |
84.80% |
80.82% |
|
University Wide |
74.00% |
71.50% |
75.60% |
78.80% |
81.63% |
Definition:
The Undergraduate Graduation Rate represents the percentage of first-time, full-time degree-seeking undergraduate students who completed their program within 1.5 times the standard duration of study.
Formula:
(Number of students who graduated within 1.5 times the standard program duration ÷ Total number of students in the original cohort) × 100
Note:
A cohort refers to all first-time, full-time degree-seeking undergraduate students who entered the University during the Fall semester of a given academic year. The Graduation Rate represents the percentage of students from a specific cohort who completed their program within 1.5 times the standard duration of their respective academic program. For example, a typical 120-credit-hour bachelor’s degree with a standard duration of four years is considered completed within 1.5 times the standard duration if finished within six years. Programs with longer standard durations are evaluated proportionately based on their approved program length.